Optional Offer×
recommends
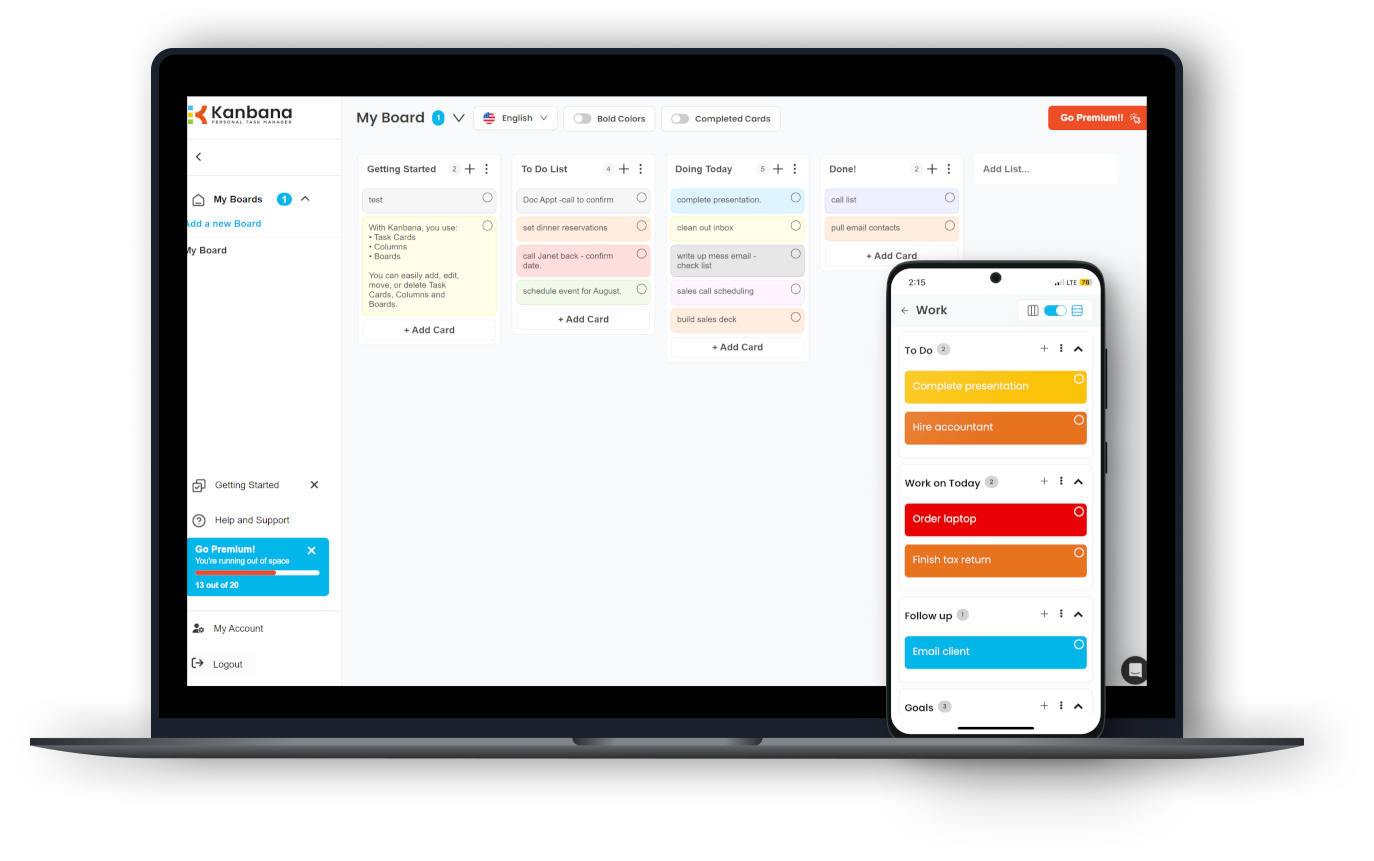
Download Kanbana for free now
Get organized and maximize your productivity!
- Use across Windows, web, iOS & Android
- Easy to use, with prebuilt templates
- Customize your look & feel
- Kanbana Anna AI chatbot coming soon!